.png)
1. Introduction
You've created indexes. You've followed the best practices. Yet your slow SQL queries persist, dragging down application performance and frustrating users.
This scenario is more common than you think. Many senior developers discover that simply adding indexes doesn't automatically solve performance problems. The reality is far more complex.
Database query optimization involves understanding execution plans, statistics, memory grants, parameter sniffing, and the intricate dance between your query and the database engine's optimizer.
In this deep dive, we'll explore why your carefully crafted indexes might not be delivering the performance gains you expected. We'll examine real production scenarios, debug execution plans, and uncover the hidden factors that cause query performance degradation.
Whether you're working with SQL Server, PostgreSQL, or any relational database, these principles apply universally to backend engineering challenges.
2. Quick Overview
Here are the primary reasons queries remain slow despite having indexes:
- Outdated statistics - The optimizer makes poor decisions based on stale data distribution information
- Parameter sniffing - Cached execution plans optimized for one parameter value perform poorly for others
- Missing covering indexes - Key lookups add expensive I/O operations
- Index fragmentation - Physical storage inefficiencies degrade read performance
- Implicit conversions - Data type mismatches prevent index usage entirely
- Poor SARGability - Functions on indexed columns prevent index seeks
- Inadequate memory grants - Queries spill to disk, causing massive slowdowns
- Wrong index type - Clustered vs non-clustered choices impact performance
3. What is Query Performance Degradation?
Query performance degradation occurs when database operations take significantly longer than expected, despite having appropriate indexing structures in place.
This isn't about missing indexes—it's about the complex interaction between your query patterns, data distribution, execution plan caching, and the database optimizer's decision-making process.
When you execute a query, the database engine doesn't just "use an index." It must:
- Parse and validate the SQL syntax
- Generate multiple potential execution plans
- Estimate costs based on statistics
- Select the "optimal" plan
- Cache that plan for reuse
- Execute against actual data
Any breakdown in this chain can result in slow SQL queries, even with perfect index definitions.
Understanding this process is critical for backend engineers working on performance-critical systems. For deeper insights into memory management that affects query performance, see our guide on Value Types, Reference Types & Memory Leak Prevention.
4. How It Works Internally
To debug query performance issues, you must understand the internal mechanics of query execution.
.png)
The Query Optimizer's Decision Process
The query optimizer is a cost-based engine. It doesn't know which plan is actually fastest—it estimates based on statistics.
Here's what happens internally:
Statistics Collection: The database maintains histograms showing data distribution. For a column with 1 million rows, statistics might show that 50% of values fall between 1-100, while only 1% fall between 1000-2000.
Cardinality Estimation: The optimizer estimates how many rows will match your WHERE clause. If statistics are outdated, these estimates become wildly inaccurate.
Cost Calculation: Each potential plan receives a cost score based on estimated I/O, CPU, and memory usage. The lowest cost wins—even if it's wrong.
Execution Plan Caching
When you execute a parameterized query for the first time, SQL Server:
- Compiles an execution plan optimized for those specific parameter values
- Stores the plan in the plan cache
- Reuses that same plan for subsequent executions
This is where parameter sniffing becomes problematic. A plan optimized for @ProductId = 1 (returning 10 rows) might be terrible for @ProductId = 999 (returning 500,000 rows).
Memory Grants and Spills
Complex queries requiring sorting, hashing, or aggregation need memory grants. If the optimizer underestimates memory requirements:
- Queries spill to TempDB
- Disk I/O replaces fast memory operations
- Performance degrades by 10-100x
For insights into async operations that can affect database call patterns, check out Top 10 Async/Await Interview Questions for .NET Developers.
Diagram Explanation
.png)
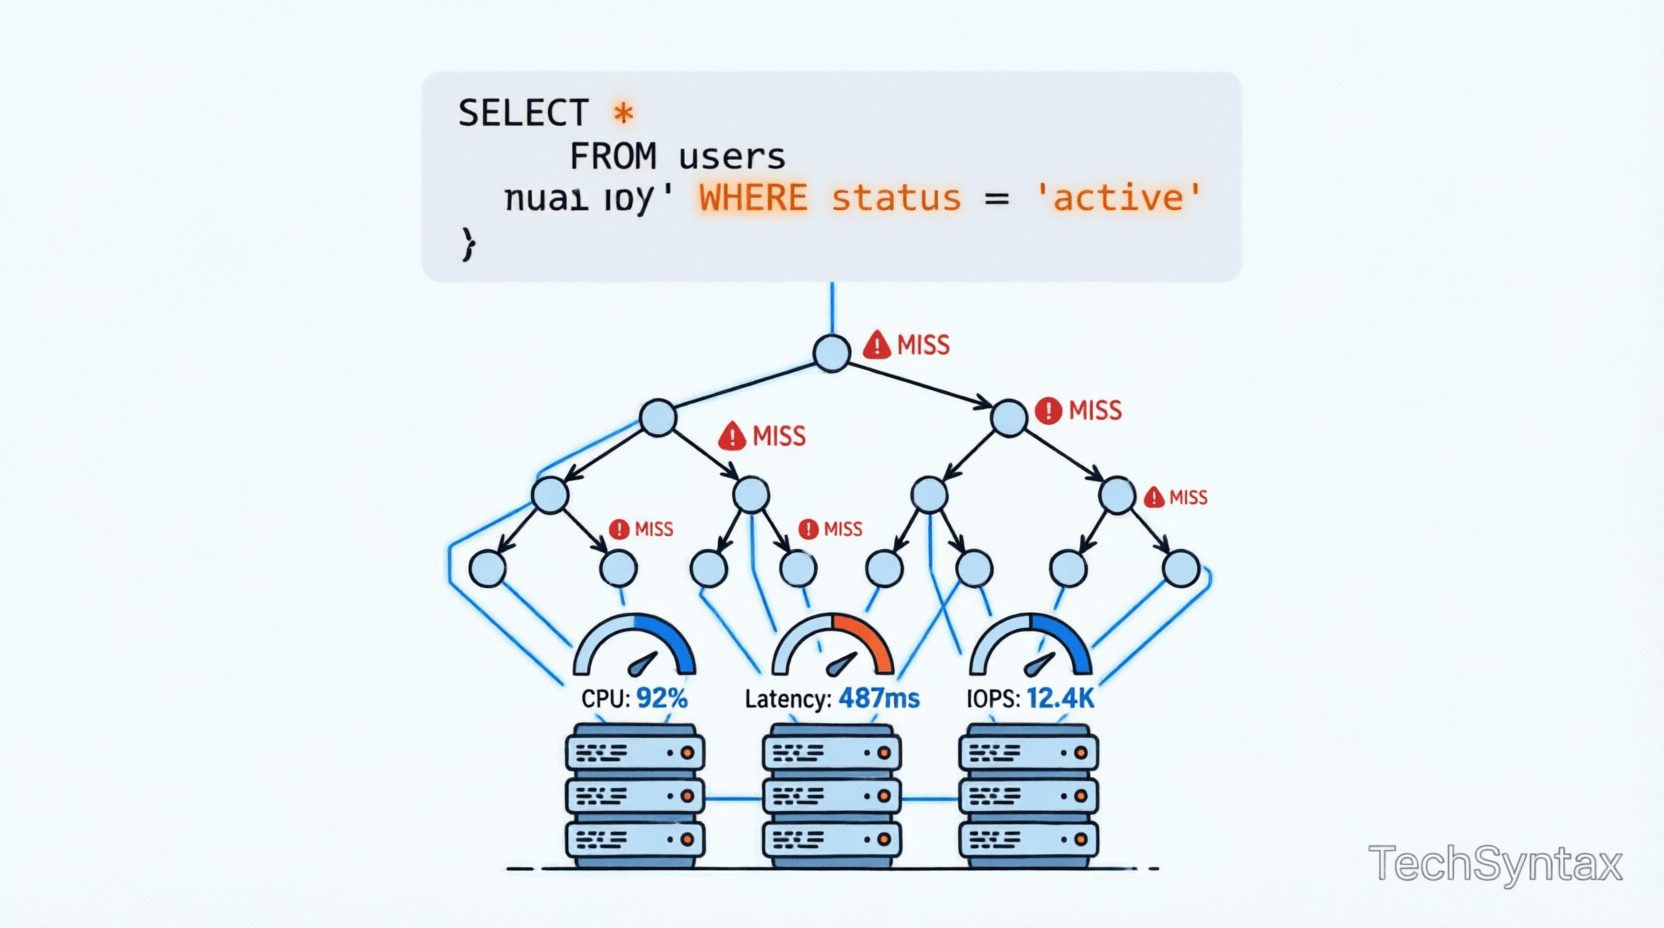
The architecture diagram above shows the complete query execution flow. Notice the decision points where performance can degrade:
- Optimizer Phase: Poor statistics lead to bad plan selection
- Index Selection: Wrong index choice triggers scans instead of seeks
- Storage Engine: Missing covering indexes force key lookups
The internal mechanism diagram illustrates parameter sniffing visually. When Plan A (optimized for small result sets) gets reused for large result sets, performance collapses.
5. Architecture or System Design
In production systems, query performance impacts cascade across your entire architecture.
Real-World Production Scenario
Consider an e-commerce platform processing 10,000 orders per hour. The OrderSearch stored procedure accepts parameters for date range, customer ID, and status.
Initial performance: 50ms average
After 6 months: 3000ms average
What changed?
- Data volume: Orders table grew from 100K to 10M rows
- Data distribution: 90% of orders now have "Completed" status (previously 30%)
- Statistics: Auto-update threshold not yet triggered
- Plan cache: Still using execution plan optimized for old data distribution
The index exists. The query hasn't changed. But performance collapsed because the optimizer's assumptions no longer match reality.
Distributed Systems Impact
In microservices architectures, slow queries create cascading failures:
- Connection pool exhaustion
- Timeout cascades across dependent services
- Circuit breakers trip
- User-facing latency spikes
Understanding these patterns is essential when designing Microservices Vs Monolithic Architecture systems.
6. Implementation Guide
Let's examine real code examples showing common performance pitfalls and their solutions.
Example 1: Parameter Sniffing Disaster
-- Stored procedure with parameter sniffing issue
CREATE PROCEDURE GetOrdersByStatus
@Status NVARCHAR(50)
AS
BEGIN
SELECT OrderId, CustomerId, OrderDate, TotalAmount
FROM Orders
WHERE Status = @Status
END

-- First execution: @Status = 'Pending' (100 rows)
-- Optimizer chooses Index Seek + Key Lookup
-- Plan cached

-- Second execution: @Status = 'Completed' (900,000 rows)
-- Reuses cached plan designed for 100 rows
-- Performance: Catastrophic
Solution: Use OPTIMIZE FOR UNKNOWN or local variables
CREATE PROCEDURE GetOrdersByStatus
@Status NVARCHAR(50)
AS
BEGIN
DECLARE @LocalStatus NVARCHAR(50) = @Status;

SELECT OrderId, CustomerId, OrderDate, TotalAmount
FROM Orders
WHERE Status = @LocalStatus
OPTION (OPTIMIZE FOR UNKNOWN);
END
Example 2: Missing Covering Index
-- Query with key lookup bottleneck
SELECT OrderId, CustomerId, OrderDate, TotalAmount, ShippingAddress
FROM Orders
WHERE CustomerId = 12345;

-- Index exists: IX_Orders_CustomerId (CustomerId)
-- Execution plan shows:
-- Index Seek (CustomerId) → Key Lookup (remaining columns)
-- Key Lookup executes once per row (expensive!)
Solution: Create covering index
CREATE INDEX IX_Orders_CustomerId_Covering
ON Orders (CustomerId)
INCLUDE (OrderId, OrderDate, TotalAmount, ShippingAddress);

-- Now: Index Seek only (no key lookup)
-- Performance improvement: 10-50x
Example 3: Implicit Conversion Killing Performance
-- Table definition
CREATE TABLE Users (
UserId VARCHAR(20) PRIMARY KEY,
Name NVARCHAR(100)
);

-- Query with implicit conversion
DECLARE @Id INT = 12345;
SELECT * FROM Users WHERE UserId = @Id;

-- SQL Server converts EVERY row's UserId to INT
-- Index scan instead of seek
-- Performance: 100x slower
Solution: Match data types exactly
DECLARE @Id VARCHAR(20) = '12345';
SELECT * FROM Users WHERE UserId = @Id;

-- Now uses index seek
-- Performance: Restored
Example 4: Non-SARGable Query
-- Non-SARGable (Search ARGument Able)
SELECT * FROM Orders
WHERE YEAR(OrderDate) = 2024;

-- Function on indexed column prevents index usage
-- Full table scan required
Solution: Make query SARGable
SELECT * FROM Orders
WHERE OrderDate >= '2024-01-01'
AND OrderDate < '2025-01-01';

-- Now uses index seek on OrderDate
-- Performance: 100x improvement
For more C# performance patterns that complement database optimization, see C# String Performance Showdown.
7. Performance Considerations
Understanding performance tradeoffs is essential for production systems.
.png)
Index Seek vs Index Scan vs Table Scan
| Operation | Avg Time | I/O Operations | When It Occurs |
|---|---|---|---|
| Index Seek | 5ms | 3-10 | Optimal: Direct navigation to data |
| Index Scan | 150ms | 500-2000 | Reading entire index (acceptable for small tables) |
| Table Scan | 2000ms | 10,000+ | Reading entire table (avoid!) |
| Key Lookup | +50ms per row | 1 per row | Fetching non-indexed columns (expensive!) |
Memory Grant Impact
Queries requiring sorts or hashes request memory grants. The difference between adequate and inadequate grants:
- Adequate grant: 50ms execution, all in memory
- Inadequate grant: 5000ms execution, spills to TempDB
Monitor with:
SELECT
session_id,
memory_grant_kb,
max_used_memory_kb,
grant_time
FROM sys.dm_exec_query_memory_grants
WHERE session_id > 50;
Statistics Update Frequency
SQL Server auto-updates statistics when:
- Table has 0-500 rows: 500 modifications trigger update
- Table has >500 rows: 500 + 20% of rows modified
For large tables, this threshold might allow millions of row changes before statistics update—causing prolonged performance degradation.
Solution: Enable AUTO_UPDATE_STATISTICS_ASYNC or schedule manual updates during maintenance windows.
For official documentation on query optimization, refer to Microsoft Docs - Query Processing Architecture.
8. Security Considerations
Performance optimization must never compromise security.
SQL Injection Risks
Dynamic SQL used to avoid parameter sniffing can introduce injection vulnerabilities:
-- VULNERABLE: Dynamic SQL without parameterization
CREATE PROCEDURE SearchOrders (@TableName NVARCHAR(100))
AS
BEGIN
EXEC('SELECT * FROM ' + @TableName); -- SQL Injection!
END
Secure approach:
-- SAFE: Use sp_executesql with parameters
CREATE PROCEDURE SearchOrders (@CustomerId INT)
AS
BEGIN
DECLARE @SQL NVARCHAR(MAX) =
N'SELECT * FROM Orders WHERE CustomerId = @Id';

EXEC sp_executesql @SQL,
N'@Id INT',
@Id = @CustomerId;
END
Execution Plan Cache Poisoning
Malicious users can exploit parameter sniffing by forcing bad plans into cache. Monitor for unusual plan cache activity:
SELECT
cp.usecounts,
cp.size_in_bytes,
st.text
FROM sys.dm_exec_cached_plans cp
CROSS APPLY sys.dm_exec_sql_text(cp.plan_handle) st
ORDER BY cp.usecounts DESC;
9. Common Mistakes Developers Make
Here are the most frequent errors that cause slow SQL queries despite indexes:
- Creating indexes without analyzing query patterns - Indexes on rarely-used columns waste resources
- Ignoring covering index opportunities - Key lookups destroy performance on large result sets
- Not monitoring statistics freshness - Outdated statistics cause optimizer confusion
- Using functions on indexed columns - WHERE YEAR(DateColumn) = 2024 prevents index usage
- Mixing data types in comparisons - Implicit conversions trigger table scans
- Over-indexing - Too many indexes slow down INSERT/UPDATE/DELETE operations
- Not testing with production-like data volumes - Queries that work on 1000 rows fail on 10 million
10. Best Practices
- Regularly update statistics - Schedule maintenance windows for large tables
- Use covering indexes strategically - INCLUDE frequently-accessed columns
- Monitor execution plans - Use Query Store or plan cache analysis
- Test parameter sniffing scenarios - Execute queries with different parameter values
- Avoid SELECT * - Only retrieve needed columns
- Use stored procedures - Better plan caching and parameterization
- Implement query timeouts - Prevent runaway queries from exhausting resources
- Index maintenance - Rebuild or reorganize fragmented indexes monthly
- Use OPTION (RECOMPILE) sparingly - Only for queries with highly variable parameters
- Monitor TempDB usage - Detect memory grant spills early
11. Real-World Production Use Cases
Case 1: E-Commerce Platform
Problem: Product search queries slowed from 100ms to 8000ms after Black Friday sale.
Root Cause: Statistics hadn't updated after 5M new product views. Optimizer chose nested loop join instead of hash join.
Solution: Updated statistics with FULLSCAN. Implemented incremental statistics for partitioned tables.
Result: Performance restored to 120ms average.
Case 2: Financial Reporting System
Problem: Month-end reports timing out after 30 minutes.
Root Cause: Parameter sniffing. Plan cached for 1-day range used for 90-day range queries.
Solution: Implemented query store forced plans. Created separate procedures for different date ranges.
Result: Reports completed in 3 minutes consistently.
Case 3: SaaS Multi-Tenant Application
Problem: Large tenants experienced 10x slower queries than small tenants.
Root Cause: Single execution plan optimized for average tenant size (10K rows) performed poorly for enterprise tenants (10M rows).
Solution: Implemented tenant-size-based query routing. Large tenants use OPTION (RECOMPILE).
Result: Performance normalized across all tenant sizes.
12. Developer Tips
Tip 1: Always examine actual execution plans, not estimated plans. The difference reveals runtime issues like parameter sniffing and memory spills.
Tip 2: Use SET STATISTICS IO, TIME ON before running queries. This reveals logical reads—the most accurate performance metric.
Tip 3: For critical queries, use Query Store to force known-good execution plans. This prevents regression after statistics updates.
Tip 4: Test queries with production data volumes in staging. A query's behavior changes dramatically at scale.
Tip 5: Monitor sys.dm_exec_query_stats regularly. Identify top CPU and I/O consumers before users complain.
13. FAQ
Why is my SQL query slow even with an index?
Your query might be slow despite indexes due to outdated statistics, parameter sniffing, missing covering indexes, implicit conversions, or non-SARGable predicates. The index exists, but the optimizer might not use it efficiently, or key lookups might add excessive I/O overhead.
How do I identify parameter sniffing issues?
Check if the same query performs differently with different parameter values. Examine the cached execution plan and compare it to an optimal plan generated with OPTION (RECOMPILE). If performance varies dramatically, parameter sniffing is likely the culprit.
What is a covering index and when should I use it?
A covering index includes all columns needed by a query, eliminating key lookups. Use covering indexes for frequently-executed queries that return the same columns. The tradeoff is increased storage and slower write operations.
How often should I update SQL Server statistics?
SQL Server auto-updates statistics, but for large tables, this might not be frequent enough. Monitor data modification rates and schedule manual updates during maintenance windows for tables with high churn. Use AUTO_UPDATE_STATISTICS_ASYNC to prevent query delays during updates.
What causes index scans instead of index seeks?
Index scans occur when the optimizer determines scanning is cheaper than seeking (small tables), when predicates aren't SARGable, when statistics are outdated, or when the query needs most rows from the table. Examine execution plans to identify the specific cause.
14. Recommended Related Articles
- Understanding Deferred Execution vs Immediate Evaluation in LINQ - Learn how LINQ query execution mirrors database query optimization patterns. Read more at Understanding Deferred Execution vs Immediate Evaluation.
- 10 Memory Management & Garbage Collection Interview Questions - Understand how .NET memory management affects database connection pooling. See Memory Management Interview Questions.
- 10 .NET API & Security Interview Questions for Backend Developers - Explore API-level performance optimization strategies. Check out .NET API & Security Interview Questions.
- The Ultimate Guide to .NET Interview Questions - Master system design questions related to database architecture. Visit The Ultimate Guide to .NET Interview Questions.
- Value Types, Reference Types & Memory Leak Prevention - Deep dive into memory management that impacts query result processing. Learn more at Value Types, Reference Types & Memory Leak Prevention.
15. Developer Interview Questions
- Explain the difference between clustered and non-clustered indexes. When would you choose one over the other?
- How does parameter sniffing work, and what strategies would you use to mitigate its negative effects?
- Describe a scenario where an index exists but the optimizer chooses not to use it. Why does this happen?
- What are covering indexes, and how do they improve query performance? What are the tradeoffs?
- How would you diagnose and fix a query that performs well in development but poorly in production?
16. Conclusion
Creating indexes is just the beginning of query optimization. Understanding why slow SQL queries persist requires deep knowledge of execution plans, statistics, parameter sniffing, and the database optimizer's decision-making process.
The most performant systems combine proper indexing with regular monitoring, statistics maintenance, and execution plan analysis. Don't just add indexes—understand how they're being used.
Remember: A query that runs fast today might crawl tomorrow as data volumes grow and distributions shift. Build monitoring into your systems, test with production-scale data, and never assume an index guarantees performance.
Master these concepts, and you'll transform from a developer who adds indexes to an engineer who architects performant, scalable database systems.
For additional resources on execution plans and statistics, consult the official SQL Server documentation on statistics and execution plans guide.
Be the first to leave a comment!