
.NET Garbage Collector Explained: Architecture, Generations, and Performance Optimization
Introduction
Memory management is one of the most critical aspects of building high-performance .NET applications. While the .NET runtime handles memory automatically through the Garbage Collector (GC), understanding its inner workings separates junior developers from senior engineers who can diagnose production memory issues and optimize critical code paths.
Every day, developers face memory-related challenges: unexpected OutOfMemoryException errors in production, performance degradation from frequent GC cycles, or memory leaks that slowly consume server resources. Without understanding how the garbage collector actually works, debugging these issues becomes guesswork.
This comprehensive guide dives deep into the .NET Garbage Collector's architecture, explaining generations, collection algorithms, and optimization strategies with practical code examples and diagrams. Whether you're building high-throughput APIs or long-running background services, mastering GC behavior is essential for building reliable, performant .NET systems.
Quick Overview: How the .NET GC Works
The .NET Garbage Collector is an automatic memory management system that reclaims memory occupied by objects no longer in use by the application. Unlike manual memory management in C++, where developers must explicitly allocate and free memory, the GC tracks object references and automatically cleans up unreachable objects.
The GC operates on a generational model, dividing the managed heap into three generations (Gen 0, Gen 1, and Gen 2) based on object lifetime assumptions. New objects start in Gen 0, and if they survive collections, they're promoted to higher generations. This design optimizes for the common pattern where most objects die young, while long-lived objects are collected less frequently.
Understanding this generational approach is crucial for optimizing application performance and preventing memory issues in production environments.

1. The Managed Heap Architecture
Understanding Heap Structure
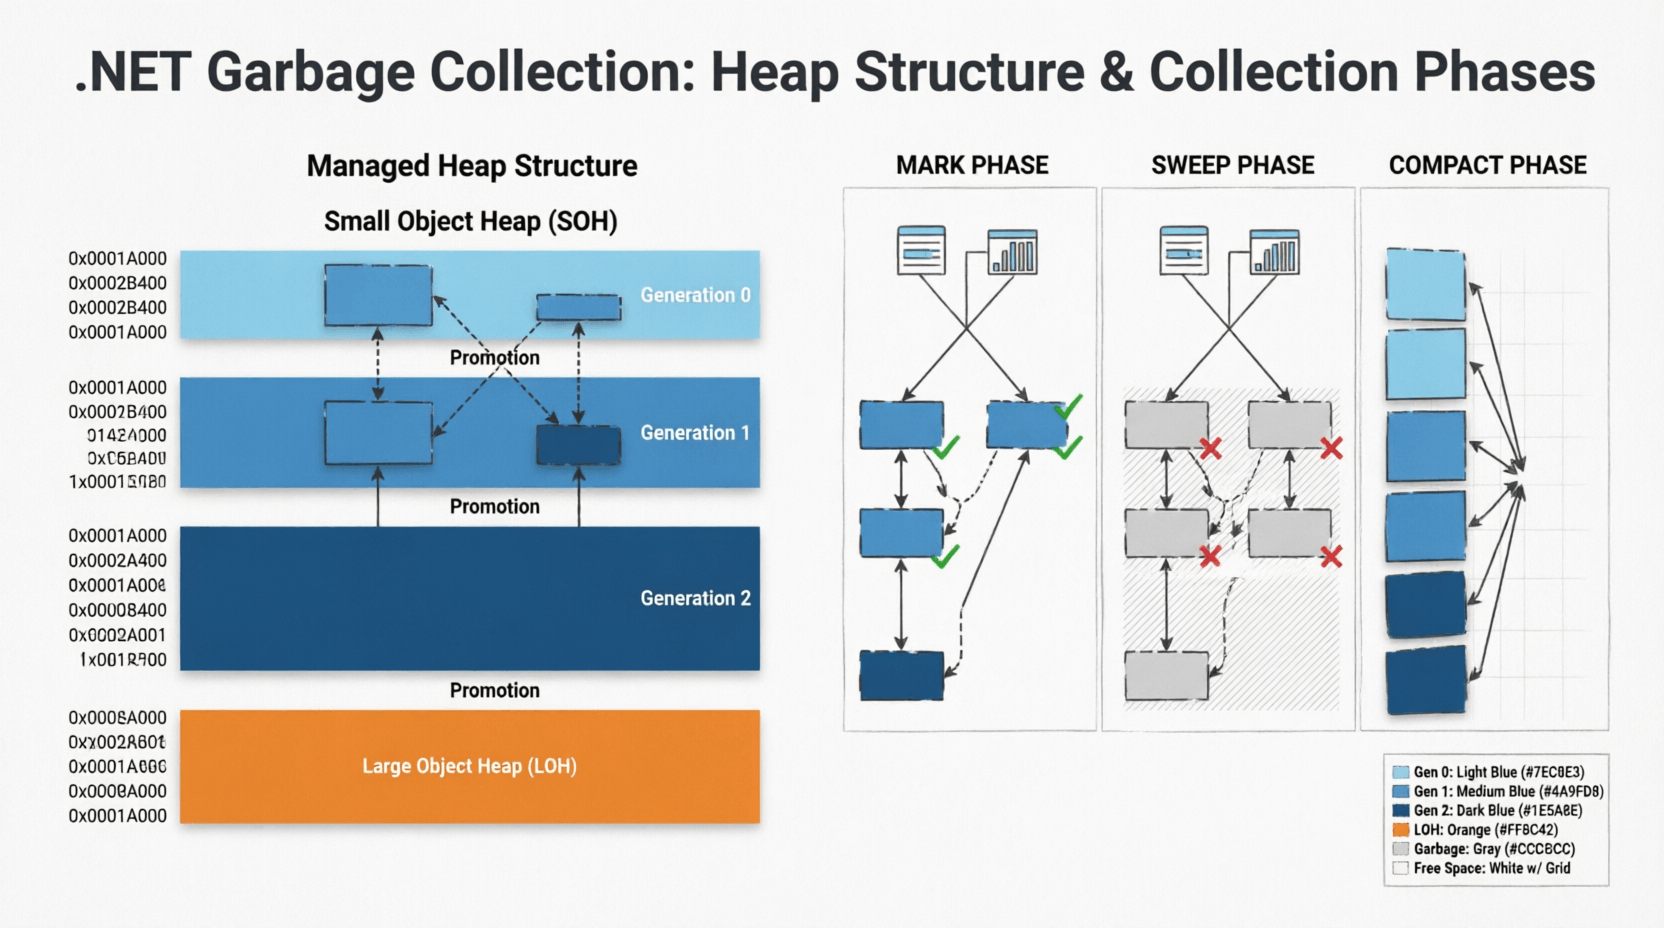
The managed heap is the memory region where all reference type objects are allocated. When you create a new object using the new keyword, the GC allocates memory from the heap. The heap is divided into two main segments:
- Small Object Heap (SOH): Stores objects smaller than 85,000 bytes, organized into three generations
- Large Object Heap (LOH): Stores objects 85,000 bytes or larger, collected only during Gen 2 collections
Here's a visual representation of the heap structure:
// Heap Structure Diagram
//
// Managed Heap
// ├── Small Object Heap (SOH)
// │   ├── Generation 0 (Newest objects, collected frequently)
// │   ├── Generation 1 (Buffer between Gen 0 and Gen 2)
// │   └── Generation 2 (Oldest objects, collected rarely)
// │
// └── Large Object Heap (LOH)
//     └── (Objects >= 85,000 bytes, collected with Gen 2)
Object Allocation Process
When the CLR allocates a new object, it uses a simple pointer bump allocation strategy for Gen 0. The GC maintains a pointer called "Next Object Pointer" that points to the next available memory location. Allocation is essentially:
// Simplified allocation process
public class ObjectAllocator
{
    private IntPtr nextObjectPointer;
    private IntPtr heapEndPointer;

    public unsafe T Allocate<T>(int size) where T : class
    {
        // Check if enough space exists
        if (nextObjectPointer + size > heapEndPointer)
        {
            // Trigger GC if heap is full
            TriggerGarbageCollection();
        }

        // Allocate by bumping pointer (very fast)
        T obj = (T)nextObjectPointer;
        nextObjectPointer += size;

        return obj;
    }
}
This pointer-bumping approach makes allocation extremely fast—typically just a few CPU instructions. The complexity comes during collection, not allocation.
Developer Tip: Understanding that allocation is cheap but collection is expensive helps you make better design decisions. It's often better to allocate short-lived objects freely than to prematurely optimize with object pooling—unless profiling shows GC pressure is a bottleneck.
2. Generational Garbage Collection Deep Dive
The Generational Hypothesis
The .NET GC is based on the generational hypothesis, which states:
- Most objects die young: Objects created recently are likely to become unreachable quickly
- Old objects live longer: Objects that survive multiple collections are likely to remain alive for a long time
- Collecting younger generations is faster: Smaller heaps mean faster collection cycles
Generation 0: The Nursery
Generation 0 is where all new objects are initially allocated. It's the smallest generation (typically 256 KB to several MB) and is collected most frequently—often multiple times per second in high-throughput applications.
public class Gen0Example
{
    public void ProcessRequest()
    {
        // These objects are allocated in Gen 0
        var dto = new UserDto();
        var validator = new UserValidator();
        var result = validator.Validate(dto);

        // If these objects aren't referenced after this method,
        // they'll be collected in the next Gen 0 collection
    }
}
When Gen 0 fills up, a Gen 0 collection occurs. The GC identifies live objects and promotes them to Gen 1. Dead objects are reclaimed, and the heap is compacted to eliminate fragmentation.
Generation 1: The Buffer Zone
Generation 1 acts as a buffer between short-lived and long-lived objects. Objects that survive Gen 0 collections are promoted to Gen 1. This generation is collected less frequently than Gen 0 but more often than Gen 2.
Gen 1 collections can include Gen 0 as well, making them slightly more expensive but still relatively fast compared to full collections.
Generation 2: The Long-Term Storage
Generation 2 contains long-lived objects that have survived multiple collections. This includes:
- Static objects that live for the application lifetime
- Cached data that persists across requests
- Singleton instances
- Large data structures promoted from Gen 1
public class Gen2Example
{
    // Static field - immediately goes to Gen 2
    private static readonly CacheService _cache = new CacheService();

    private readonly List<DomainEntity> _longLivedCollection;

    public MyService()
    {
        // This collection will likely end up in Gen 2
        // if the service instance lives long enough
        _longLivedCollection = new List<DomainEntity>();
    }
}
Gen 2 collections are the most expensive because they:
- Scan the entire managed heap (Gen 0, 1, and 2)
- Include the Large Object Heap
- Require more compaction work
- Can cause noticeable application pauses
Developer Tip: Minimize Gen 2 collections by avoiding unnecessary long-lived object allocations. If you're seeing frequent Gen 2 collections in production, profile your application to identify objects being promoted unnecessarily. For more optimization strategies, check out AI-powered performance analysis tools that can help identify memory patterns.
Generation Promotion Mechanics
Objects are promoted between generations based on survival:
// Object promotion example
public class PromotionExample
{
    public void DemonstratePromotion()
    {
        // Allocation in Gen 0
        var obj = new TemporaryObject();

        // If obj survives this collection → Gen 1
        // If obj survives next collection → Gen 2
    }

    // Force promotion by keeping reference
    private object _promotedObject;

    public void KeepAlive()
    {
        _promotedObject = new object(); // Will eventually reach Gen 2
    }
}
3. Garbage Collection Algorithms and Phases
The Mark-and-Sweep Algorithm
The .NET GC uses a mark-and-sweep algorithm with compaction. Each collection cycle goes through distinct phases:
Phase 1: Marking
During the mark phase, the GC identifies all reachable objects by traversing the object graph starting from root references (stack variables, static fields, CPU registers).
// Marking phase visualization
// Root References → Object Graph Traversal
//
// Stack Roots          Static Roots
//     ↓                    ↓
// [Local vars]        [Static fields]
//     ↓                    ↓
//     →→→ Object A ←←←←←←←←
//         ↓      ↑
//         ↓      ← (circular reference handled)
//     Object B
//     ↓      ↓
// Object C  Object D
//
// Marked objects = Reachable (kept)
// Unmarked = Garbage (collected)
The GC marks each reachable object with a bit flag. Objects not marked after the traversal are considered garbage.
Phase 2: Sweeping
During the sweep phase, the GC reclaims memory from unmarked objects. In .NET, this phase is combined with compaction to prevent heap fragmentation.
Phase 3: Compacting
Compaction moves live objects together to eliminate gaps left by collected objects. This prevents fragmentation but requires updating all references to moved objects.
// Before compaction:
// [Obj A][GARBAGE][Obj B][GARBAGE][Obj C][GARBAGE]
//
// After compaction:
// [Obj A][Obj B][Obj C][FREE SPACE...............]
//
// All references to Obj B and Obj C are updated
Concurrent vs. Blocking Collections
.NET offers different GC modes that affect application performance:
| GC Mode | Description | Use Case |
|---|---|---|
| Workstation GC | Optimized for client apps, concurrent Gen 0/1 collections | Desktop applications, low-latency services |
| Server GC | Multiple GC threads, higher throughput, more memory | High-throughput web APIs, backend services |
| Concurrent GC | Most work done concurrently with application threads | Low-latency requirements, interactive apps |
| Non-Concurrent GC | Blocking collections, simpler but causes pauses | Memory-constrained environments |
Configure GC mode in your appsettings.json or .runtimeconfig.json:
{
  "configProperties": {
    "System.GC.Server": true,
    "System.GC.Concurrent": true,
    "System.GC.RetainVM": false
  }
}
4. Large Object Heap (LOH) and Performance Implications

Understanding LOH Behavior
The Large Object Heap handles objects larger than 85,000 bytes (approximately 85 KB). Unlike the SOH, the LOH has unique characteristics:
- No compaction by default: LOH is not compacted during collections (unless explicitly requested in .NET 4.5.1+), leading to fragmentation
- Collected only with Gen 2: LOH collections always trigger full Gen 2 collections
- Allocated directly: Large objects skip Gen 0 and 1, going straight to LOH
public class LOHExample
{
    public void DemonstrateLOH()
    {
        // This array is ~100 KB (25,000 * 4 bytes) → LOH
        int[] largeArray = new int[25000];

        // This string is likely > 85 KB → LOH
        string hugeString = new string('x', 100000);

        // List with large capacity → LOH
        var largeList = new List<byte>(100000);
    }
}
LOH Fragmentation Problem
Since the LOH isn't compacted by default, repeated allocation and deallocation of large objects creates fragmentation:
// LOH Fragmentation Example
//
// Initial state:
// [Obj A: 100KB][Obj B: 100KB][Obj C: 100KB]
//
// After Obj B is collected:
// [Obj A: 100KB][FREE: 100KB][Obj C: 100KB]
//
// Try to allocate 150 KB object → FAILS
// Even though 100 KB is free, it's not contiguous!
//
// Result: OutOfMemoryException despite free memory
Solutions for LOH Fragmentation
1. Enable LOH Compaction ( .NET 4.5.1+):
using System.Runtime.GCSettings;

public class LOHConfiguration
{
    public static void EnableLOHCompaction()
    {
        GCSettings.LargeObjectHeapCompactionMode =
            GCLargeObjectHeapCompactionMode.CompactOnce;
    }
}
2. Use ArrayPool for Large Buffers:
using System.Buffers;

public class PooledBufferExample
{
    public void ProcessLargeData()
    {
        // Rent from pool instead of allocating on LOH
        byte[] buffer = ArrayPool<byte>.Shared.Rent(100000);

        try
        {
            // Use buffer
            ProcessData(buffer);
        }
        finally
        {
            // Return to pool (not deallocated)
            ArrayPool<byte>.Shared.Return(buffer);
        }
    }
}
3. Reuse Large Objects:
public class LargeObjectReuse
{
    // Reuse same buffer instead of allocating new ones
    private readonly byte[] _reusableBuffer = new byte[100000];

    public void ProcessMultipleTimes()
    {
        // Reuse _reusableBuffer instead of allocating
        ReadIntoBuffer(_reusableBuffer);
        Process(_reusableBuffer);

        ReadIntoBuffer(_reusableBuffer); // Reuse
        Process(_reusableBuffer);
    }
}
Developer Tip: For high-performance APIs, always profile LOH usage with tools like dotMemory or PerfView. If you see frequent LOH collections, consider object pooling or restructuring data to avoid large allocations. This is especially critical in high-throughput backend services where memory pressure can cause cascading performance issues.
5. Finalization and the IDisposable Pattern
Understanding Finalizers
Finalizers (destructors in C#) allow objects to clean up unmanaged resources before being collected. However, they come with significant performance costs:
public class ProblematicFinalizer
{
    ~ProblematicFinalizer()
    {
        // This runs on the finalizer thread
        // Delays object collection by one GC cycle
        CleanupUnmanagedResources();
    }

    // Object with finalizer survives first collection
    // and is placed in the finalization queue
}
Objects with finalizers follow a special collection path:
- Object becomes unreachable
- GC identifies it as garbage but sees finalizer
- Object is moved to finalization queue (not collected yet)
- Finalizer thread runs the finalizer
- Object becomes eligible for collection in next GC cycle
This two-cycle collection process means finalizable objects survive at least one extra generation, increasing memory pressure.
The IDisposable Pattern
The IDisposable pattern provides deterministic cleanup, allowing developers to release resources immediately rather than waiting for the GC:
public class DatabaseConnection : IDisposable
{
    private IntPtr _unmanagedHandle;
    private bool _disposed = false;

    // Public Dispose method
    public void Dispose()
    {
        Dispose(true);
        GC.SuppressFinalize(this); // Skip finalization
    }

    // Finalizer as safety net
    ~DatabaseConnection()
    {
        Dispose(false);
    }

    protected virtual void Dispose(bool disposing)
    {
        if (_disposed) return;

        // Clean up unmanaged resources
        if (_unmanagedHandle != IntPtr.Zero)
        {
            CloseHandle(_unmanagedHandle);
            _unmanagedHandle = IntPtr.Zero;
        }

        // Clean up managed resources only if called explicitly
        if (disposing)
        {
            // Dispose managed objects here
        }

        _disposed = true;
    }
}
Using Statement Pattern
Always use the using statement for IDisposable objects to ensure deterministic cleanup:
// Correct usage
public void ProcessData()
{
    using (var connection = new DatabaseConnection())
    {
        connection.Execute("SELECT * FROM Users");
    } // Dispose called automatically here
}

// Or with C# 8.0+ using declaration
public void ProcessDataModern()
{
    using var connection = new DatabaseConnection();
    connection.Execute("SELECT * FROM Users");
    // Dispose called when method exits
}
6. GC Performance Optimization Strategies
.png)
Reducing GC Pressure
GC pressure refers to the frequency and duration of garbage collection cycles. High GC pressure causes application pauses and reduced throughput.
Common causes of high GC pressure:
- Excessive short-lived object allocations
- Large object allocations causing LOH collections
- Unnecessary boxing/unboxing
- Inefficient string concatenation
- Overuse of LINQ creating intermediate collections
// High GC Pressure Example
public class HighPressureCode
{
    public List<string> ProcessUsers(IEnumerable<User> users)
    {
        // Creates multiple intermediate collections
        return users
            .Where(u => u.IsActive)           // Allocation 1
            .Select(u => u.Name.ToUpper())    // Allocation 2
            .OrderBy(n => n)                  // Allocation 3
            .ToList();                        // Allocation 4
    }
}

// Optimized Version
public class LowPressureCode
{
    public List<string> ProcessUsersOptimized(IEnumerable<User> users)
    {
        var result = new List<string>();

        foreach (var user in users)
        {
            if (user.IsActive)
            {
                result.Add(user.Name.ToUpper());
            }
        }

        result.Sort();
        return result;
    }
}
Object Pooling
For frequently allocated objects, pooling can reduce GC pressure:
using System.Collections.Concurrent;

public class ObjectPool<T> where T : class, new()
{
    private readonly ConcurrentBag<T> _pool = new();

    public T Rent()
    {
        return _pool.TryTake(out var item) ? item : new T();
    }

    public void Return(T item)
    {
        // Reset object state before returning
        Reset(item);
        _pool.Add(item);
    }

    private void Reset(T item)
    {
        // Clear object state
    }
}

// Usage in high-throughput scenario
public class HighThroughputService
{
    private readonly ObjectPool<RequestContext> _contextPool
        = new ObjectPool<RequestContext>();

    public async Task HandleRequest()
    {
        var context = _contextPool.Rent();
        try
        {
            await ProcessAsync(context);
        }
        finally
        {
            _contextPool.Return(context);
        }
    }
}
Span<T> and Memory<T> for Zero-Allocation Operations
Modern .NET provides Span<T> and Memory<T> types for working with memory without allocations:
public class SpanExample
{
    // Traditional approach - allocates new string
    public string ExtractSubstring(string input)
    {
        return input.Substring(10, 20); // Allocation!
    }

    // Span approach - no allocation
    public ReadOnlySpan<char> ExtractSubstringSpan(string input)
    {
        return input.AsSpan(10, 20); // No allocation!
    }

    // Parse without allocation
    public int ParseNumber(ReadOnlySpan<char> text)
    {
        if (int.TryParse(text, out var result))
            return result;
        return 0;
    }
}
Developer Tip: Use BenchmarkDotNet to measure GC impact of your code changes. A method that's 10% slower but allocates 90% less memory might actually improve overall throughput by reducing GC pauses. Learn more about performance optimization techniques for production systems.
Common Mistakes Developers Make with GC
- Overusing finalizers: Adding finalizers "just in case" without unmanaged resources, causing unnecessary GC overhead
- Ignoring IDisposable: Not disposing streams, database connections, or HTTP clients, leading to resource leaks
- Event handler leaks: Subscribing to events without unsubscribing, keeping objects alive indefinitely
- Static collection growth: Adding to static lists/dictionaries without bounds, causing unbounded Gen 2 growth
- Capturing closures: Lambda expressions capturing variables unintentionally, extending object lifetimes
- Boxing in hot paths: Boxing value types in performance-critical code, creating unnecessary heap allocations
Real-World Engineering Scenario: Optimizing a High-Traffic API
Problem: A .NET Web API handling 10,000 requests/second experiences periodic latency spikes from 50ms to 500ms every few seconds.
Diagnosis: Using PerfView and dotnet-counters, we discover:
- Gen 2 collections occurring every 3-5 seconds
- LOH allocations of 200 KB per request
- High allocation rate: 500 MB/second
Root Cause: Each request allocates a 200 KB byte array for image processing, which goes straight to LOH. With 10,000 req/sec, this creates massive LOH pressure.
Solution:
// Before: LOH allocation per request
public class ImageController : ControllerBase
{
    [HttpPost("process")]
    public IActionResult ProcessImage(IFormFile file)
    {
        var buffer = new byte[file.Length]; // LOH allocation!
        file.OpenReadStream().Read(buffer, 0, buffer.Length);

        var result = ImageProcessor.Process(buffer);
        return Ok(result);
    }
}

// After: Using ArrayPool
public class ImageControllerOptimized : ControllerBase
{
    [HttpPost("process")]
    public async Task<IActionResult> ProcessImage(IFormFile file)
    {
        var buffer = ArrayPool<byte>.Shared.Rent((int)file.Length);
        try
        {
            using var stream = file.OpenReadStream();
            await stream.ReadAsync(buffer.AsMemory(0, (int)file.Length));

            var result = ImageProcessor.Process(buffer);
            return Ok(result);
        }
        finally
        {
            ArrayPool<byte>.Shared.Return(buffer);
        }
    }
}
Result: Gen 2 collections dropped from every 3 seconds to every 2 minutes. P99 latency stabilized at 60ms with no spikes.
Performance Notes and Scalability Implications
Understanding GC behavior is crucial for scaling .NET applications:
- Server GC vs Workstation GC: Server GC uses multiple threads and heaps, providing better throughput for multi-core servers but higher memory usage
- Background GC: .NET's background GC allows Gen 0/1 collections to run concurrently with Gen 2, reducing pause times
- Memory pressure: The GC responds to memory pressure by triggering collections more aggressively
- NUMA awareness: Server GC is NUMA-aware on multi-socket servers, optimizing memory locality
For distributed systems handling millions of requests, even small GC optimizations compound significantly. A 1ms reduction in GC pause time across 1 million requests saves 1000 seconds of total latency.
Recommended Related Articles
- Mastering Memory Management in .NET: Value Types, Reference Types & Memory Leak Prevention
- 10 Memory Management & Garbage Collection Interview Questions for .NET Developers
- 10 .NET API & Security Interview Questions for Backend Developers
- Top 10 Async/Await Interview Questions for .NET Developers
- The Ultimate Guide to .NET Interview Questions (2026)
Developer Interview Questions
- Explain the difference between Gen 0, Gen 1, and Gen 2 collections. When does each occur?
Answer: Gen 0 collects new objects frequently, Gen 1 collects objects surviving Gen 0, and Gen 2 collects long-lived objects and the LOH. Gen 0 triggers when the generation is full, Gen 1 during Gen 0 collections if needed, and Gen 2 when memory pressure is high or explicitly requested. - What is the Large Object Heap and why is it problematic?
Answer: The LOH stores objects larger than 85 KB and is only collected during Gen 2 collections. It's not compacted by default, leading to fragmentation that can cause OutOfMemoryException even when free memory exists. - When should you implement IDisposable vs relying on finalizers?
Answer: Always prefer IDisposable for deterministic cleanup of both managed and unmanaged resources. Use finalizers only as a safety net for unmanaged resources, and call GC.SuppressFinalize in Dispose to avoid the performance cost of finalization. - How would you diagnose and fix high GC pressure in a production API?
Answer: Use tools like PerfView, dotnet-counters, or dotMemory to identify allocation hotspots. Common fixes include: object pooling, reducing LINQ allocations, using Span<T>, avoiding LOH allocations, and caching reusable objects. - What's the difference between concurrent and non-concurrent GC? When would you choose each?
Answer: Concurrent GC performs most collection work on background threads, reducing pause times but using more CPU. Non-concurrent GC blocks application threads during collection. Choose concurrent for low-latency apps, non-concurrent for memory-constrained environments.
Frequently Asked Questions
1. How can I force garbage collection in .NET?
Use GC.Collect() to force collection, but this is rarely recommended. The GC is highly optimized, and manual collection usually harms performance. Only use it in specific scenarios like after loading large amounts of data that are immediately released.
2. What causes OutOfMemoryException in managed .NET applications?
Common causes include: LOH fragmentation preventing large allocations, unbounded growth of static collections, event handler leaks keeping objects alive, and excessive memory usage exceeding process limits. Use memory profilers to identify the root cause.
3. Does the .NET GC compact the Large Object Heap?
By default, the LOH is not compacted to avoid performance overhead. However, starting in .NET 4.5.1, you can request LOH compaction using GCSettings.LargeObjectHeapCompactionMode = GCLargeObjectHeapCompactionMode.CompactOnce.
4. How do I know if my application has a memory leak?
Signs include: continuously growing memory usage over time, increasing Gen 2 collection frequency, and memory not returning to baseline after load spikes. Use tools like dotMemory, PerfView, or Application Insights to track memory trends and identify objects not being collected.
5. What is the difference between GC.Collect() and GC.WaitForPendingFinalizers()?
GC.Collect() triggers an immediate garbage collection, while GC.WaitForPendingFinalizers() blocks the current thread until the finalizer thread has processed all objects in the finalization queue. They're often used together when you need deterministic cleanup of finalizable objects.
Conclusion
Mastering the .NET Garbage Collector is essential for building high-performance, scalable applications. Understanding generations, heap structure, and collection algorithms empowers you to diagnose memory issues, optimize critical code paths, and make informed architectural decisions.
Key takeaways:
- The generational model optimizes for the common pattern where most objects die young
- LOH allocations should be minimized or pooled to prevent fragmentation
- Implement IDisposable for deterministic cleanup and avoid unnecessary finalizers
- Profile before optimizing—use tools like PerfView and dotMemory to identify real bottlenecks
- Modern .NET features like Span<T> and ArrayPool<T> can dramatically reduce GC pressure
In production systems handling high throughput, even small GC optimizations compound into significant performance gains. By applying the concepts from this guide—reducing allocations, pooling large objects, and understanding collection behavior—you'll build .NET applications that scale efficiently and maintain consistent latency under load.
Remember: the goal isn't to eliminate GC (that's impossible in managed code) but to work with it efficiently. Profile, measure, and optimize based on data—not assumptions.
Be the first to leave a comment!